Knowing which pests drive the most internet searches (in the U.S.) can help pest control companies drive more traffic to their websites. Among the takeaways is that the top 6 pests drive more internet search than all other pests combined. The big surprise is that the combination of searches for bedbug (one word) and bed bugs (two words) didn’t even make the top 10 (although there is a ten-year upward trend). We’d love to hear your thoughts, insights, and theories on social media or via our contact form.
Better understanding which pests consumers want help managing and which pests drive the most internet searches can help pest control companies prioritize which pests they should build web pages, blog posts and email campaigns about.
Volume vs Value of Internet Searches
This list tells which pests drive the most search volume. What it doesn’t tell is the value of that search traffic. In other words, fleas (#1) generate more search volume than termites (#3) but that doesn’t mean that search traffic from “flea control” is as valuable as search traffic from “termite control”.
Which Data We Looked At
First, we created a list of every possible type and species of pest. This way we could compare ants (in general) to fire ants, carpenter ants etc. Second, we chose to only look at search phrases that included the name of the pest and the word “control”. This way we could eliminate searches like “what does a flea look like” but include searches like “flea control Chicago” or “flea control tips”. Third we chose to look at a 10-year average. We may do a post about “the worst pests of 2016” but it will probably be a top five or top ten list (due to the fact that, there is not enough data in a twelve month period for many pests). Finally, we looked at search data from Google for each pest and graded each pest on a curve relative to the pest with the most searches (fleas).
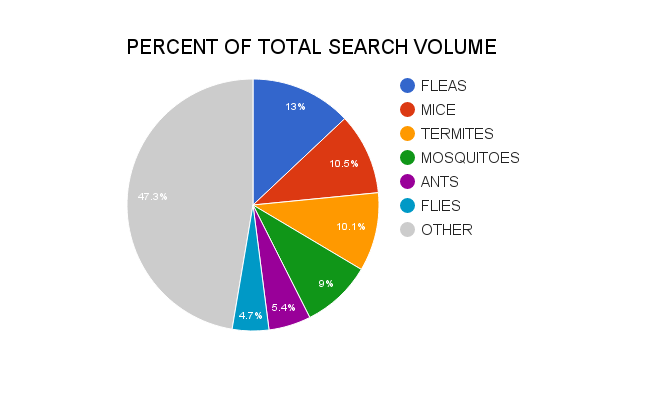
The Top 6 Generate a Majority Of The Search Volume
The Full List (With Relative Search Volume In Parenthesis)
Here’s the full list, with relative search volume, the state with the most per capita search volume and the time of year that generates the most internet searches.
#1 Fleas (100)
Worst State: Florida
Peak Season: June/July
Search Volume Trend: Downwards the last six years.
#2 Mice (81)
Worst State: Nebraska
Peak Season: December
Search Volume Trend: Flat for the last five years.
#3 Termites (78)
Worst State: Arizona
Peak Season: May
Search Volume Trend: Flat for eight years.
#4 Mosquitoes (69)
Worst State: Florida
Peak Season: June
Search Volume Trend: Sharply upwards the last six months (flat for eight years previously).
#5 Ants (42)
Worst State: Oregon
Peak Season: May/June
Search Volume Trend: Downwards for ten years.
#6 Flies (36)
Worst State: Texas
Peak Season: June
Search Volume Trend: Flat for four years.
#7 Scale (28)
Worst State: Insufficient Data
Peak Season: Insufficient Data
Search Volume Trend: Flat for eight years.
#8 Birds (28)
Worst State: Colorado
Peak Season: May
Search Volume Trend: Flat for six years.
#9 Spiders (25)
Worst State: Michigan
Peak Season: Summer
Search Volume Trend: Flat for three years.
#10 Ticks (25)
Worst State: Insufficient Data
Peak Season: May
Search Volume Trend: Flat for six years (trending upwards previous to 2010).
#11 Rats (23)
Worst State: California
Peak Season: Fall
Search Volume Trend: Flat for six years.
#12 Rodents (22)
Worst State: California
Peak Season: Fall
Search Volume Trend: Upwards for three years.
#13 Beetles (19)
Worst State: Insufficient Data
Peak Season: July
Search Volume Trend: Sharply downwards for five years.
#14 Bees (17)
Worst State: California
Two Peak Seasons: May & August
Search Volume Trend: Flat for three years.
#15 Cockroaches/Roaches (17)
Worst State: Florida
Peak Season: June
Search Volume Trend: Mixed (up and down) for eight years.
#16 Moles (11)
Worst State: California
Peak Season: April
Search Volume Trend: Flat for two years.
#17 Snakes (11)
Worst State: Texas
Peak Season: May/June
Search Volume Trend: Sharply upwards for six months.
#18 Bats (11)
Worst State: Texas
Peak Season: August
Search Volume Trend: Mixed for ten years.
#19 Squirrels (9)
Worst State: California
Peak Season: Insufficient Data
Search Volume Trend: Flat for two years.
#20 Bed bugs/Bedbugs (9)
Worst State: Illinois
Peak Season: July/August
Search Volume Trend: Upwards for ten years.
#21 Wasps (9)
Worst State: Nebraska
Peak Season: July/August
Search Volume Trend: Flat for three years.
#22 Aphids (9)
Worst State: Washington
Peak Season: June
Search Volume Trend: Downwards for five years.
#23 Mites (8)
Worst State: Insufficient Data
Peak Season: June
Search Volume Trend: Mixed for ten years.
#24 Moths (8)
Worst State: Insufficient Data
Peak Season: May/June
Search Volume Trend: Upwards for two years.
#25 Gophers (6)
Worst State: California
Peak Season: May through July
Search Volume Trend: Downwards for five years.
#26 Crickets (6)
Worst State: Insufficient Data
Peak Season: Insufficient Data
Search Volume Trend: Insufficient Data
#26 Through #52 With Relative Search Volume
Raccoons (6), Skunks (6), Stink Bugs (4), Japanese Beetles (4), Fire Ants (4), Scorpions (4), Carpenter Ants (4), Voles (4), Centipedes (3), Earwigs (3), Gnats (3), Silverfish (3), Hornets (3), Brown Recluses (3), Slugs (3), Snails (1), Black Widows (1), Yellow Jackets (1), Carpenter Bees (1), Cicadas (1), Fruit Flies (<1), Kudzu (<1), Weevils (<1), Boxelder Bugs (<1), Millipedes (<1) Woodchucks (<1)
